Introduction | Methodology | Scenarios | Results
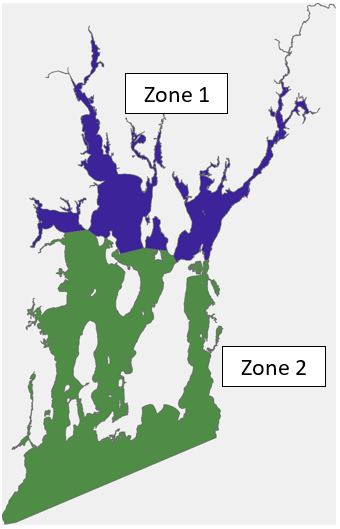
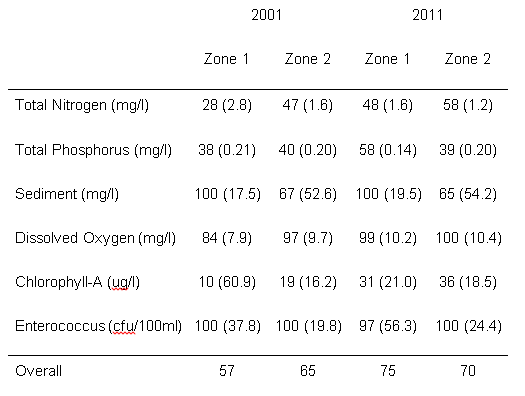
Recent History, 2001-2011: We broke the study area into two zones based on different oceanographic conditions within the larger watershed. Using the IAM, we estimate that in 2001 overall water quality in zones 1 was 57 and in zone 2 was 65. These values fall between a water quality level adequate for fishing and for swimming. Nearly all subindex values increased between 2001 and 2011 due to lower loads and concentrations, pushing the overall water quality for both zones above the level considered adequate for swimming (EPA, 2009). Net loads for TN and TP decreased significantly due to wastewater treatment facility upgrades over the time period, despite slightly higher estimated loads from non-point sources of roughly 1% for both zones and contaminants.
Dam Removal: We find that dam removal in the watersheds of zone 1 and zone 2 would reduce water quality by 6.3 and 2.5 points in their respective zones in the Bay compared to actual water quality metrics observed in 2011. However, it should be noted that dam removals have other potential benefits including improved fish passage and aquatic habitat and reduced flood hazards.
Future Scenarios: We first addressed the question of where to prioritize conservation in the watershed by comparing different scenarios for the amount and distribution of conversions of natural areas to development (based on Harvard Forest’s New England Landscape Futures Scenarios). This analysis contrasts development impacts under a scenario where local communities are carefully planned and experience managed growth (“Connected Communities”), vs. a rapid and uncontrolled development scenario (“Growing Global”). Under the latter scenario, a significant increase in bacterial contamination was forecast, in the absence of substantial new investments in expanded and upgraded wastewater treatment systems.
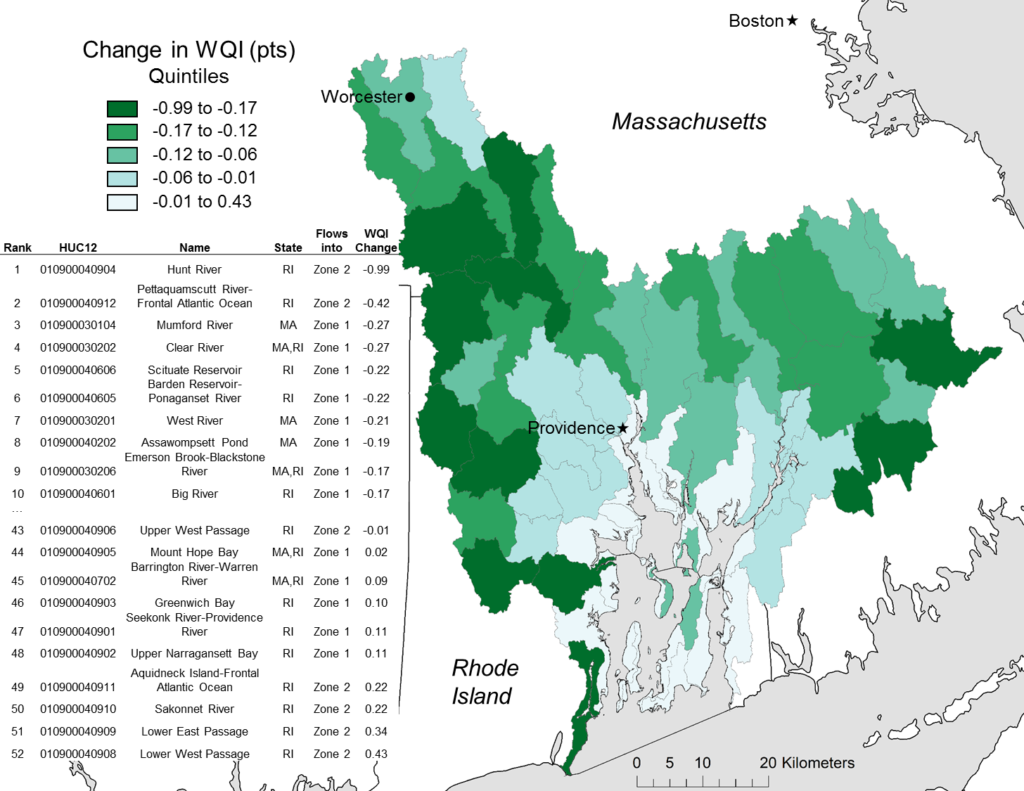
Marginal Change: A final scenario explored the potential effects of converting all natural areas in the watershed to development. We visualize this using a marginal values map (see figure below), where each subwatershed’s value is the marginal contribution of that particular watershed, with all other watersheds held at baseline values. We found that changes to the overall water quality index were modest, reflecting several important factors:
- A significant portion of land adjacent to the bay is already urbanized, with lower potential water quality impact from conversion of natural lands to developed lands, all else equal;
- Dams play a significant role in retaining nitrogen and sediment in-stream leading to lower influence of upstream export/retention by natural lands, all else equal;
- Transitioning to development from natural areas reduces sediment transport to the bay by trapping sediments, all else equal;
- These results implicitly capture existing pollution regulations for developed areas that may mitigate pollution that would occur in the absence of these laws.